The City of Oberlin has been working on putting together a Stormwater Strategic Plan to better understand how stormwater is affecting the City, it's residents, and it's businesses, so we can work together to develop a comprehensive approach to managing stormwater.
To see the latest version of the Stormwater Strategic Plan, CLICK HERE.
What is Stormwater?
Stormwater is rainwater or melted snow that runs off of streets, lawns, and other surfaces. Sometimes it is also called run off.
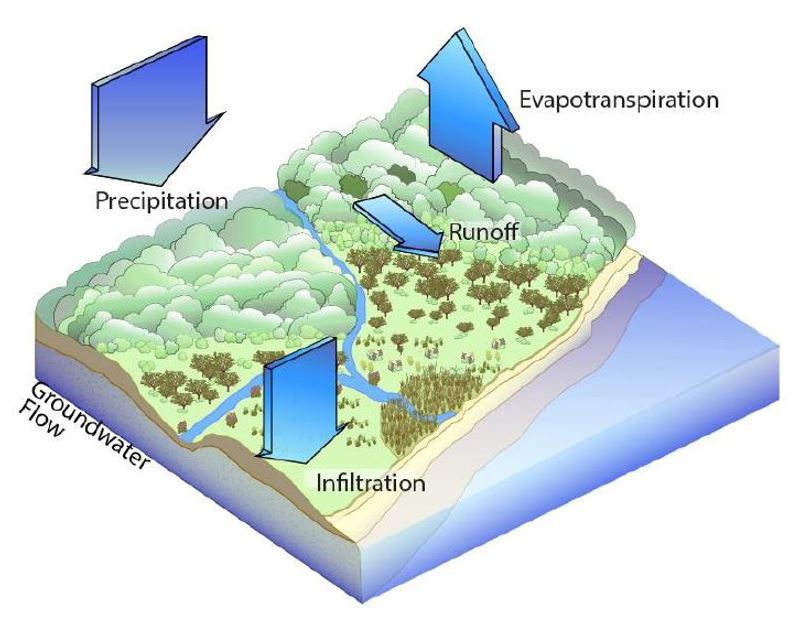
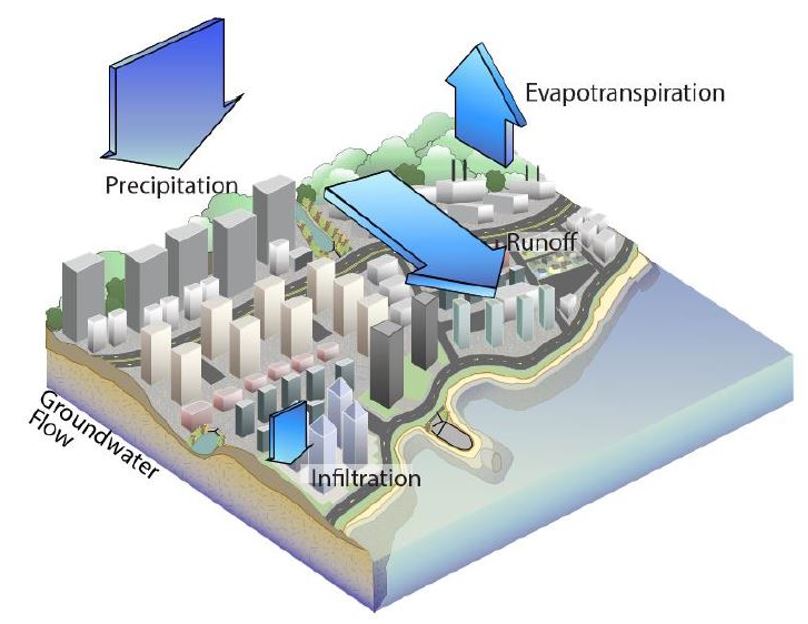
As an area becomes developed, concrete, asphalt, and other impervious surfaces (surfaces that water cannot move through) increases how much stormwater becomes run off in that area.
More stormwater run off can carry more pollutants into our waterways. Stormwater pollutants include chemicals like fertilizer and pesticide, pet poop, litter, loose sediment (dirt), and even heat that is picked up as the water flows over hot pavement.
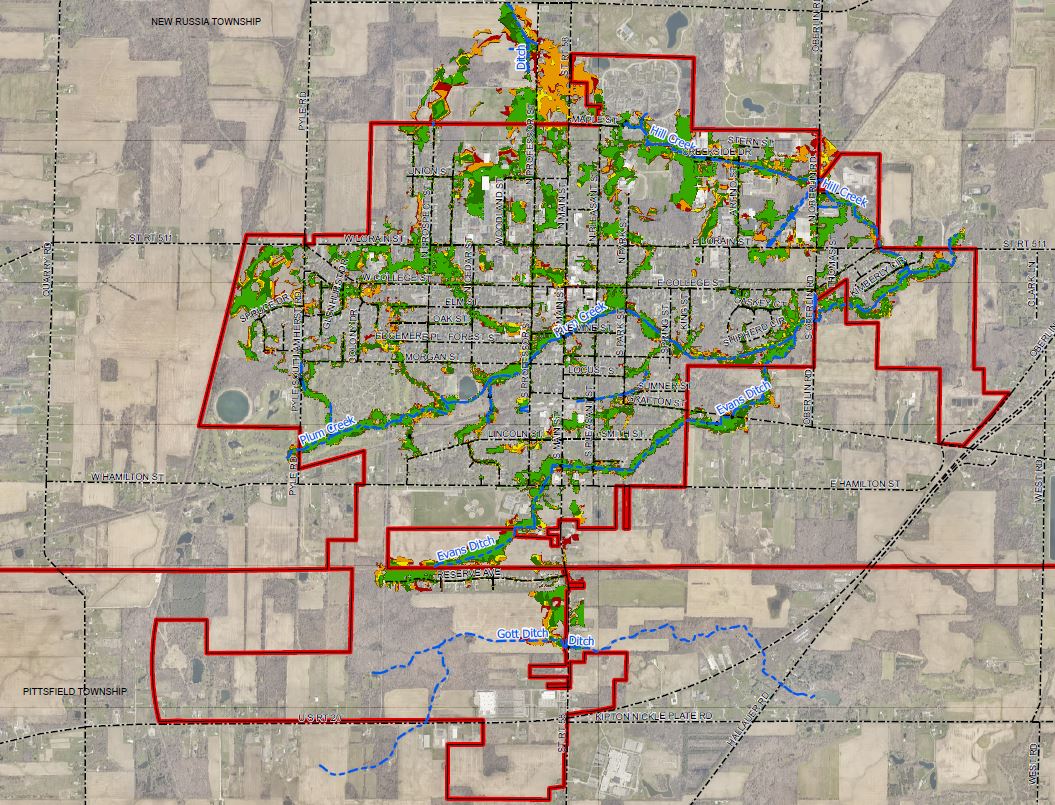
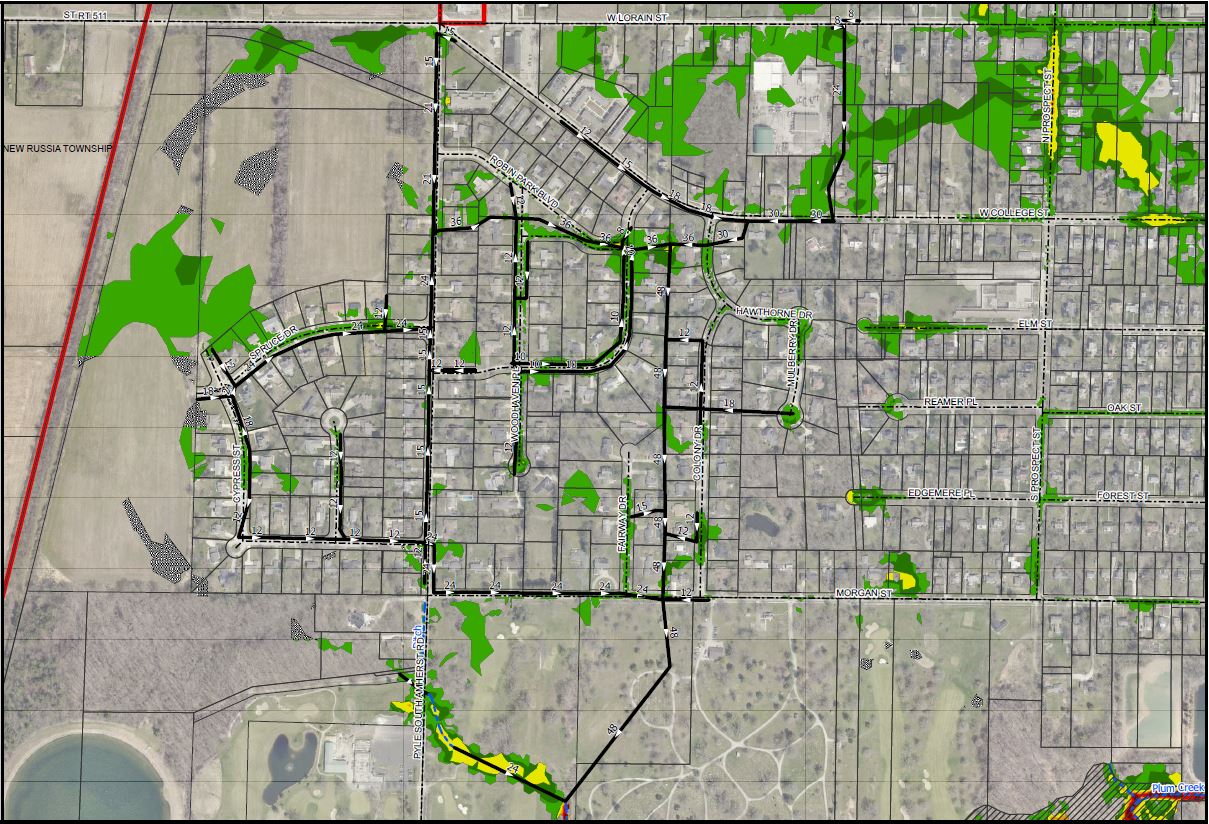
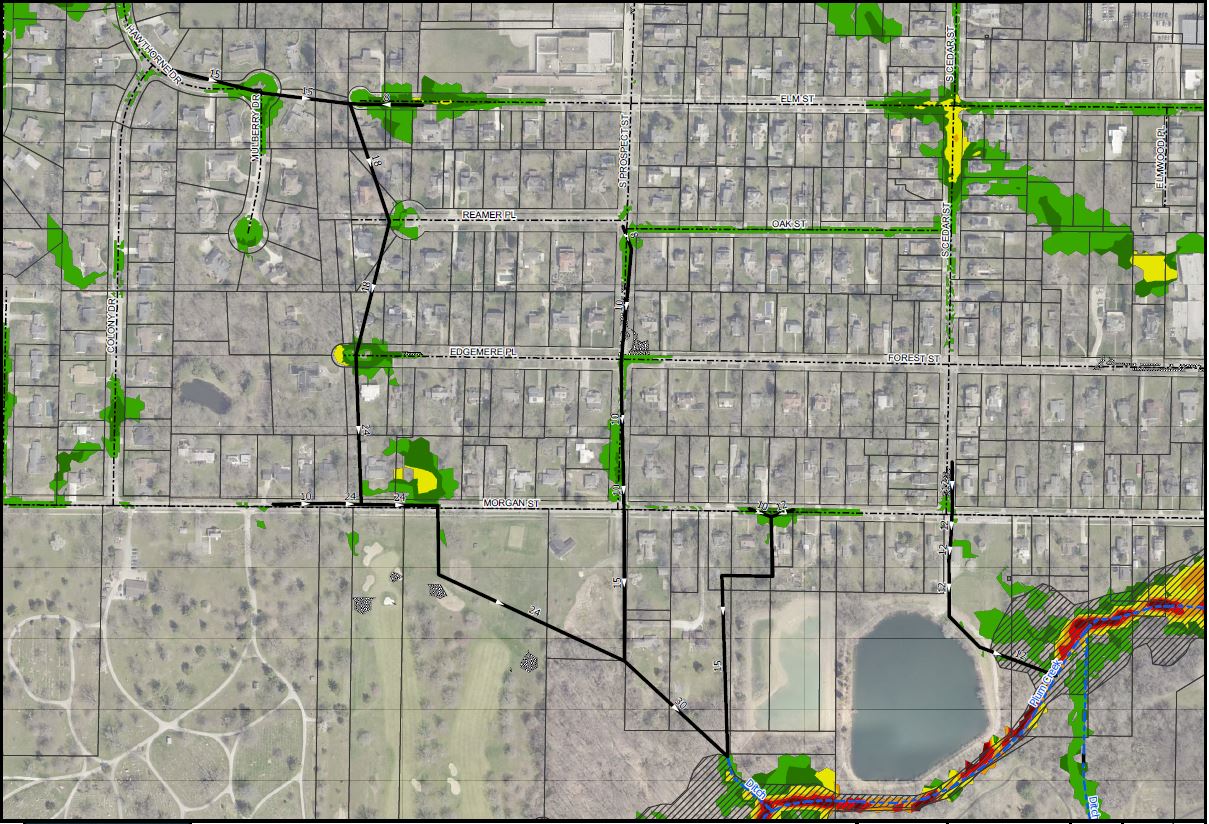
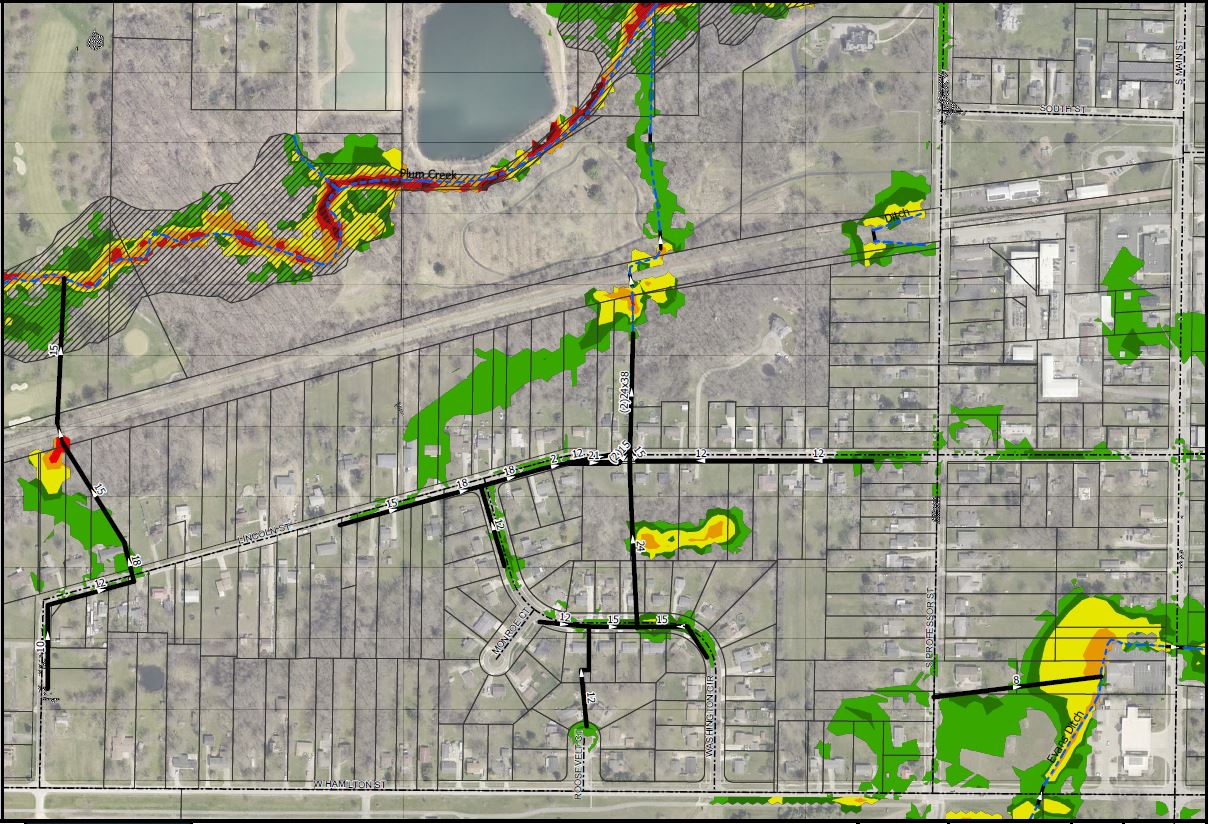
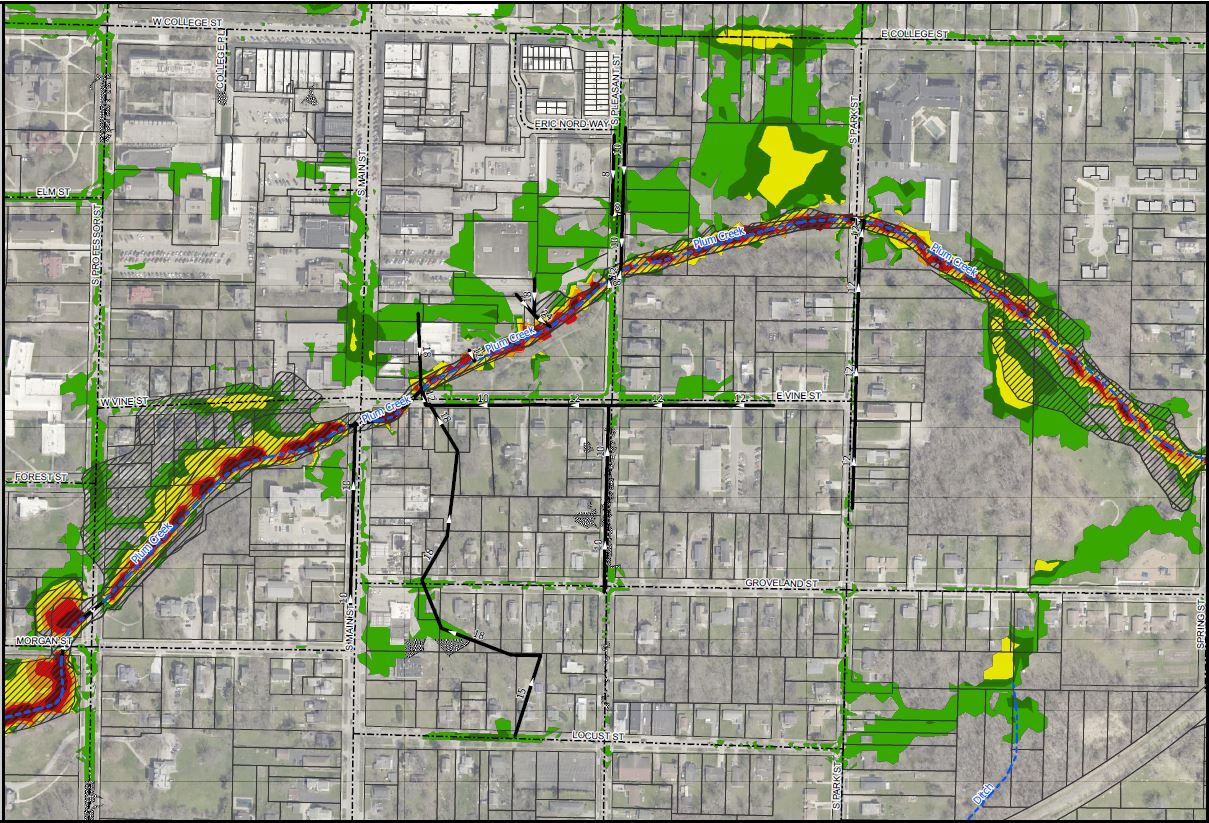
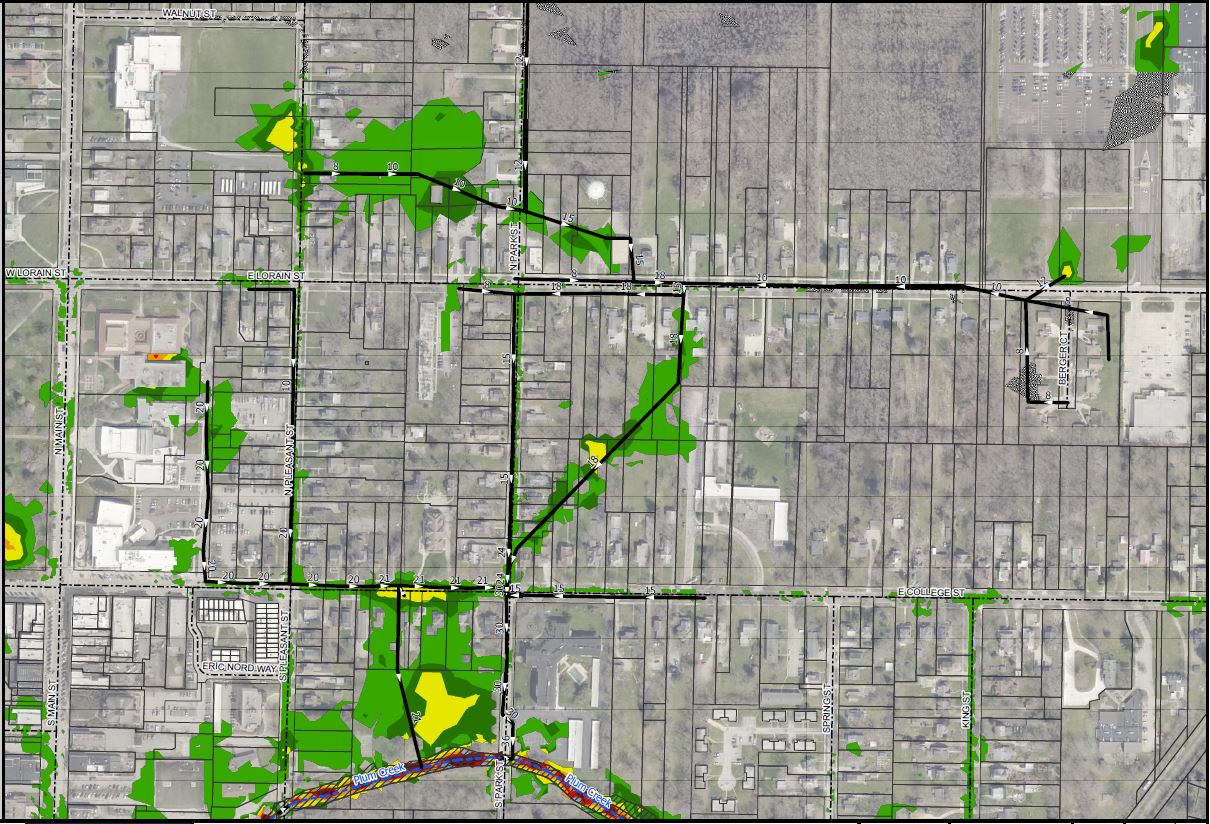
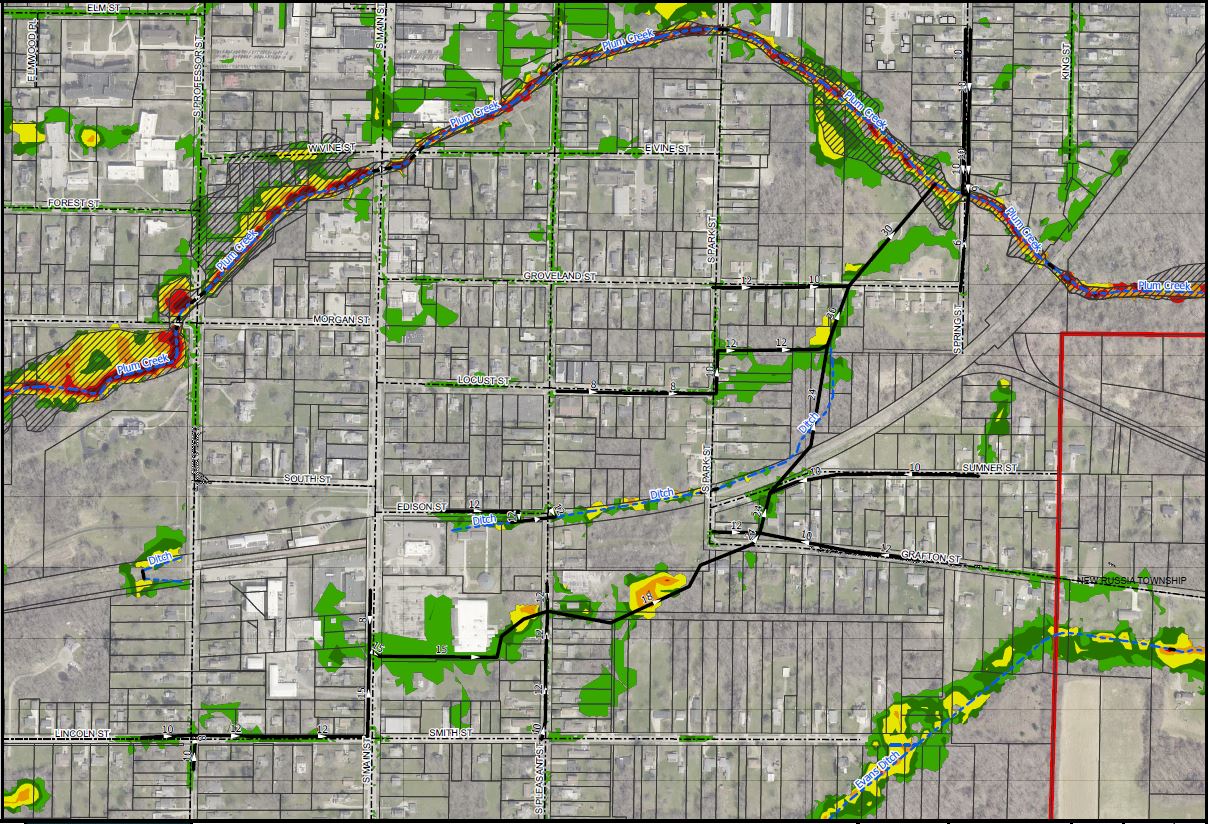
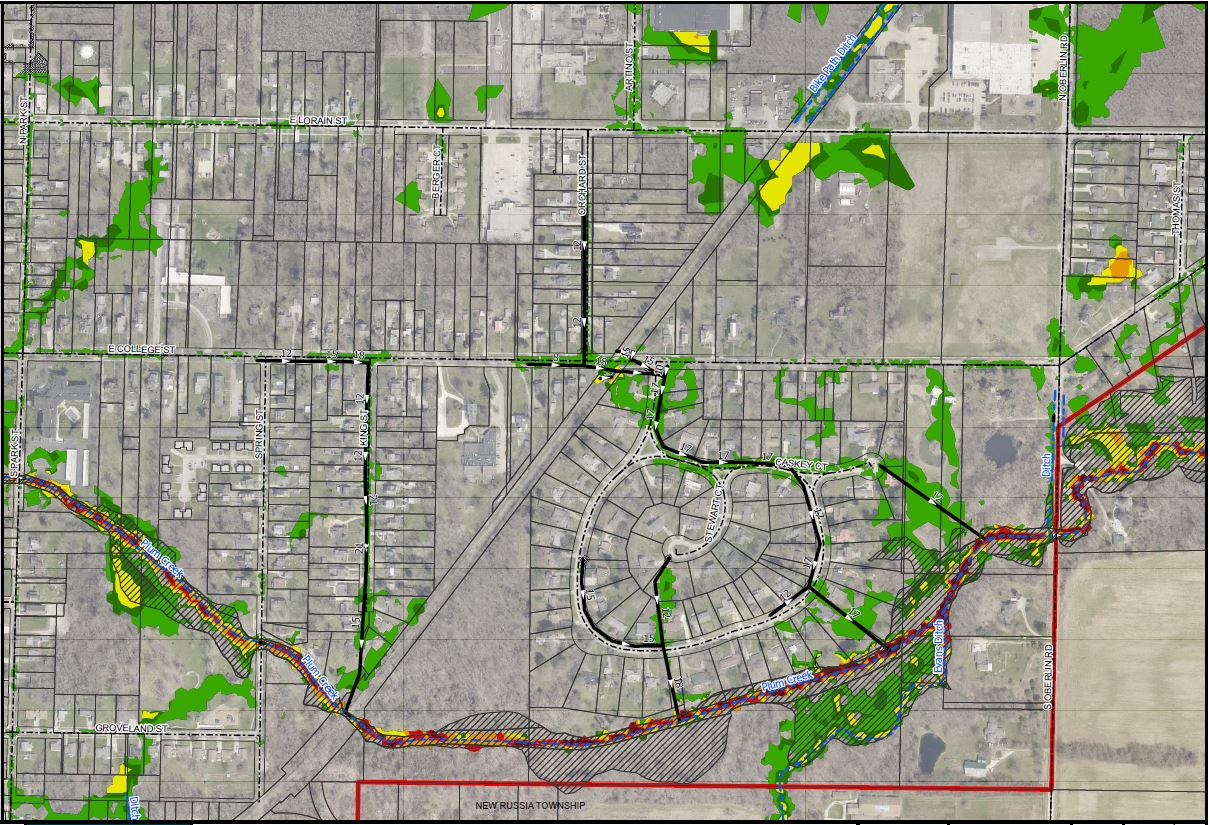
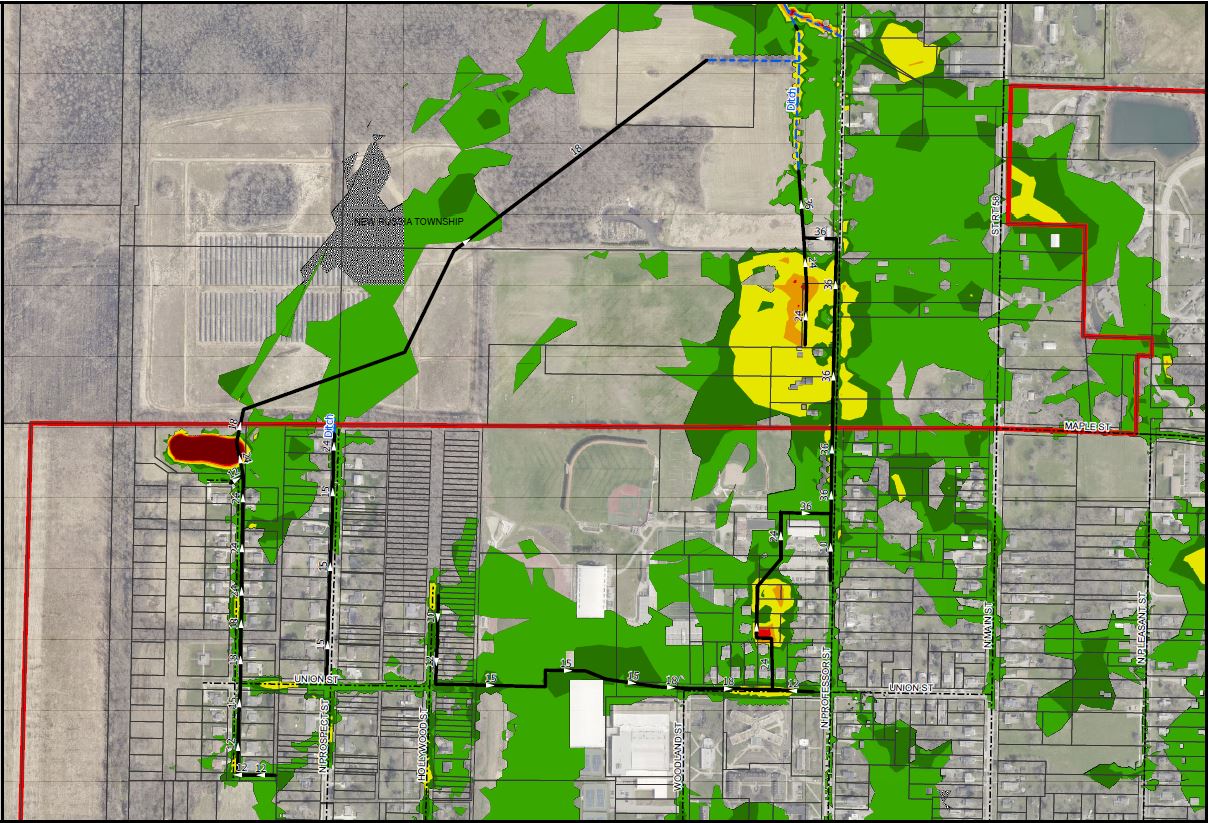
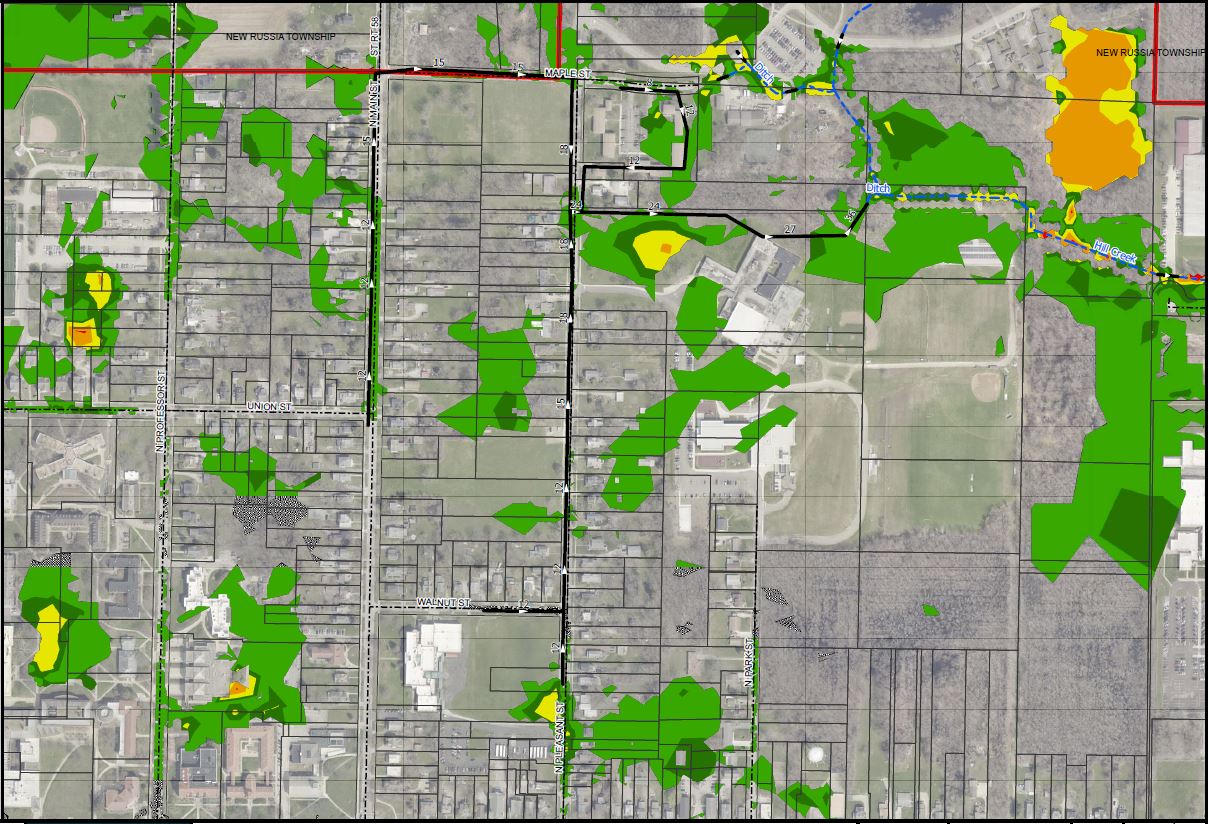
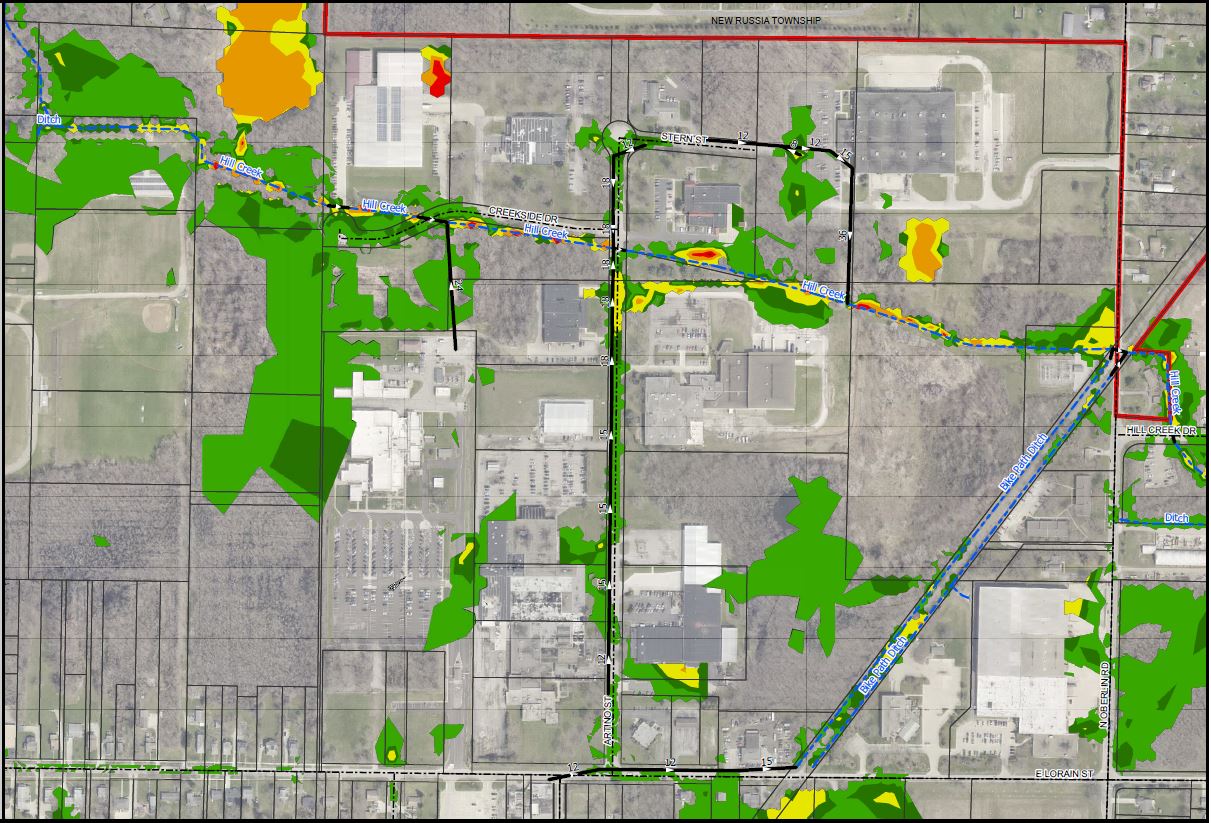
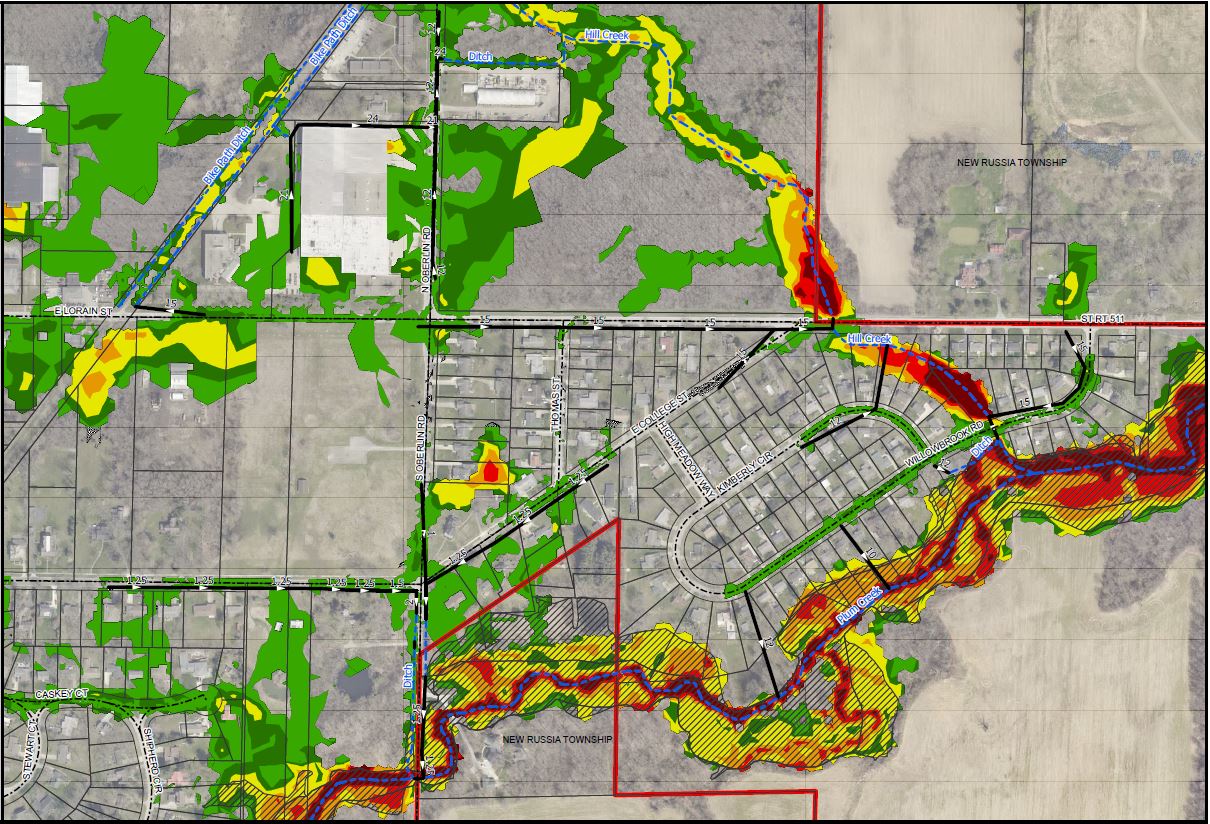
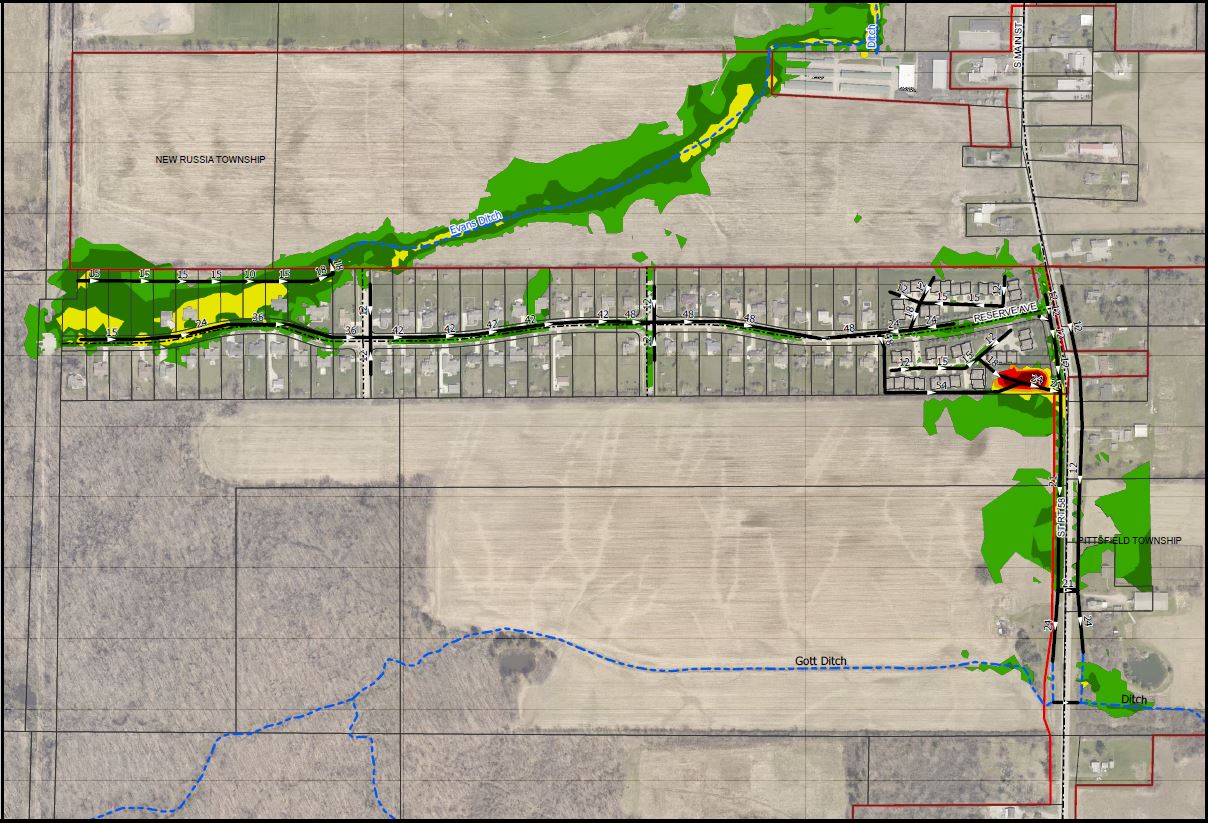
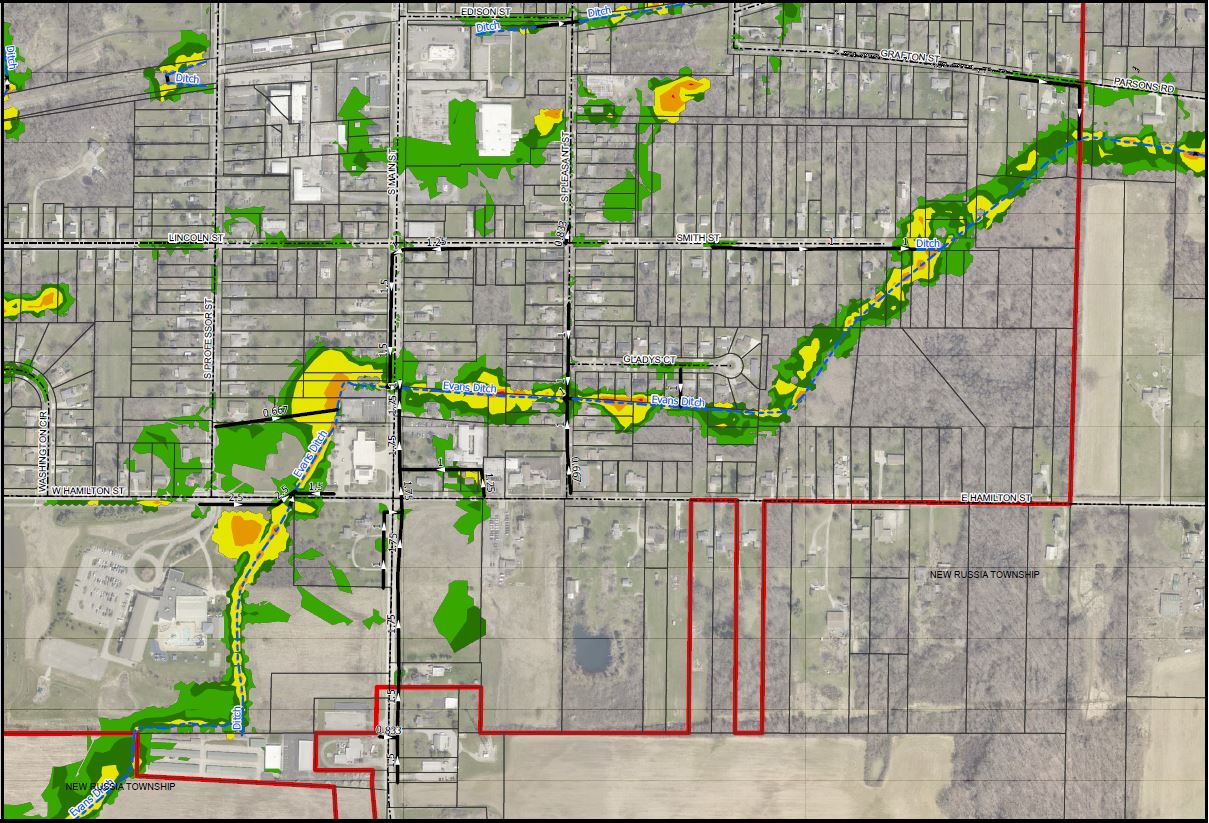
The City of Oberlin used public reports and infrastructure records to create computer generated models for how stormwater runoff is expected to flow and pond during different kinds of storms. These models can be reviewed below, represented as color-coded maps.
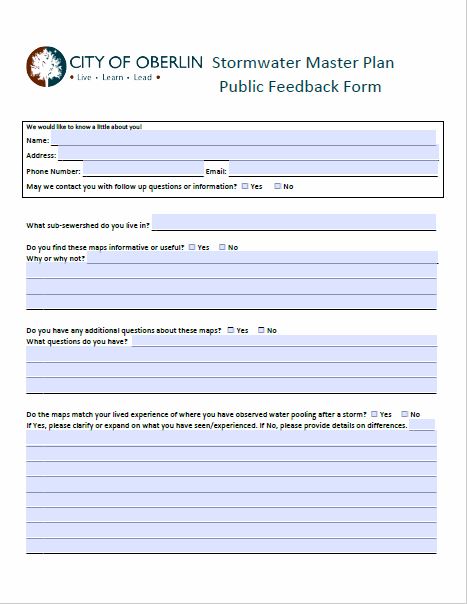
Now, YOUR FEEDBACK on these maps is being asked for.
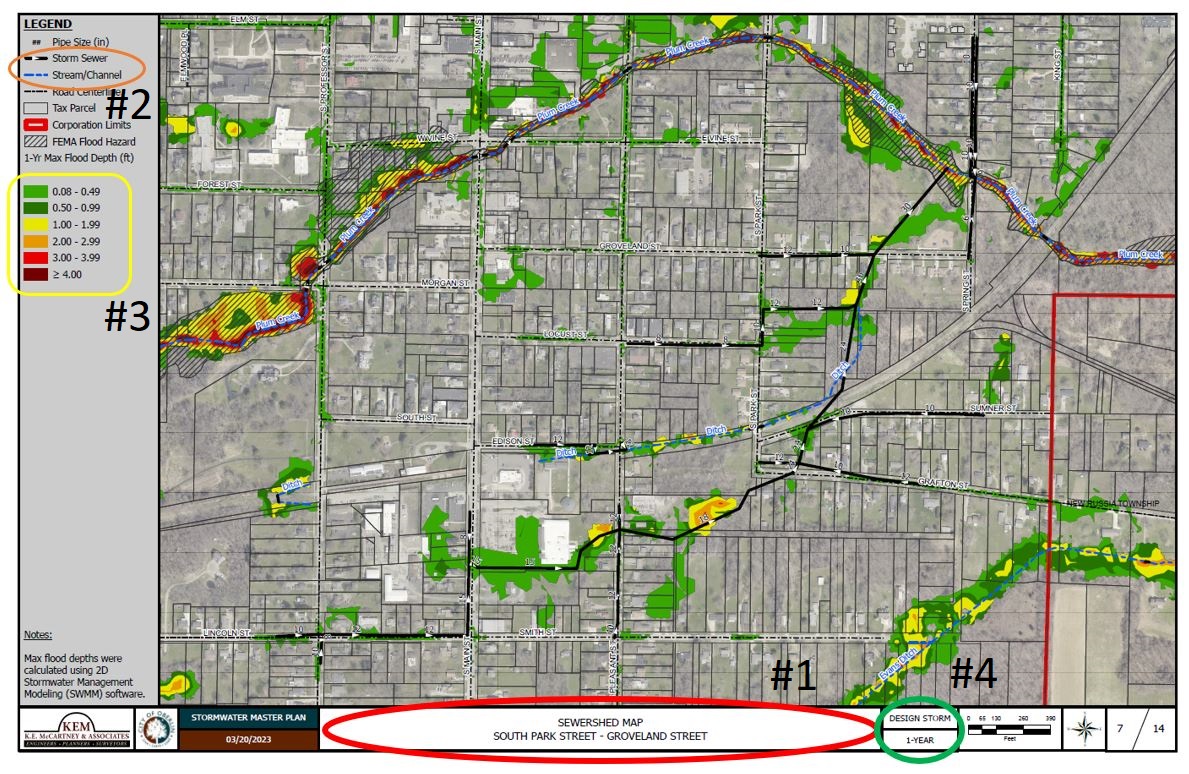
#1 (Red Circle): Make sure the title of the map matches the general area of where you live, work, or are intending to be looking at on the map.
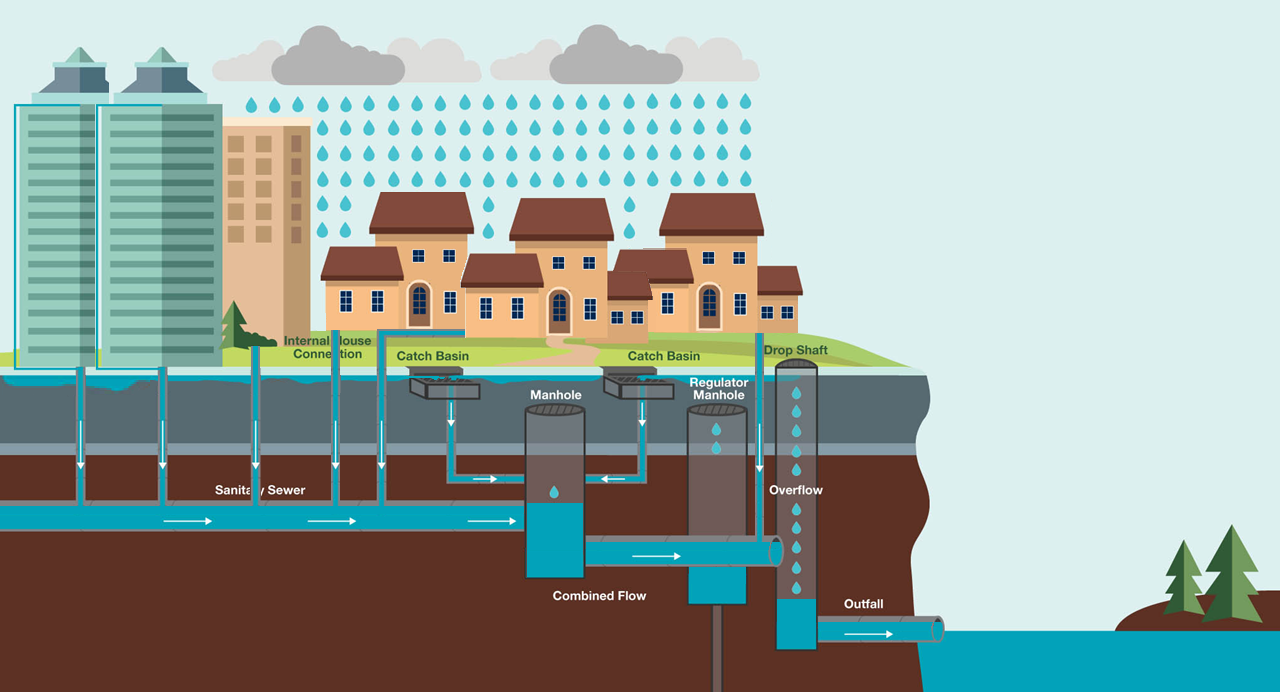
#2 (Orange Circle): Look at what kind of stormsewer is presented on the map. The stormsewer may consist of underground stormsewer pipes, as well as aboveground ditchways or creek segments. Understanding the existing routes that water is supposed to take through the sewershed can help with understanding why water may be pooling aboveground in those areas.
#3 (Yellow Circle): The flood depths are color coded by how deep the water is expected to pool above ground during a rain storm.
#4 (Green Circle): There are different types of maps to look at. These are based on how strong or intense a storm is expected to be. The stronger, or greater intensity, the storm, the less likely it is expected to happen. - The "1 year" map shows what is expected to happen every year (100% annual chance). - The "10 year" map shows what is 10% likely to happen each year. - The "100 year" map shows what is 1% likely to happen each year.
As you look at the maps below, there is a survey to fill out with your thoughts and feedback! This will help us refine the Stormwater Master Plan to more accurately understand how stormwater is affecting our community.
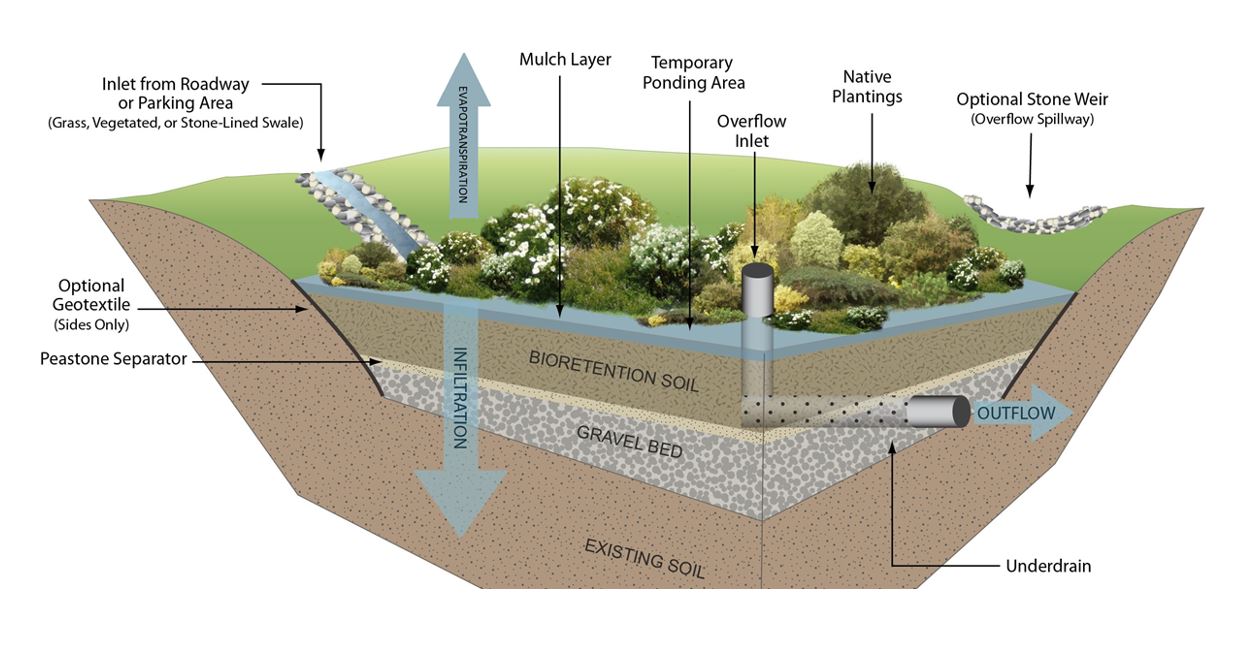
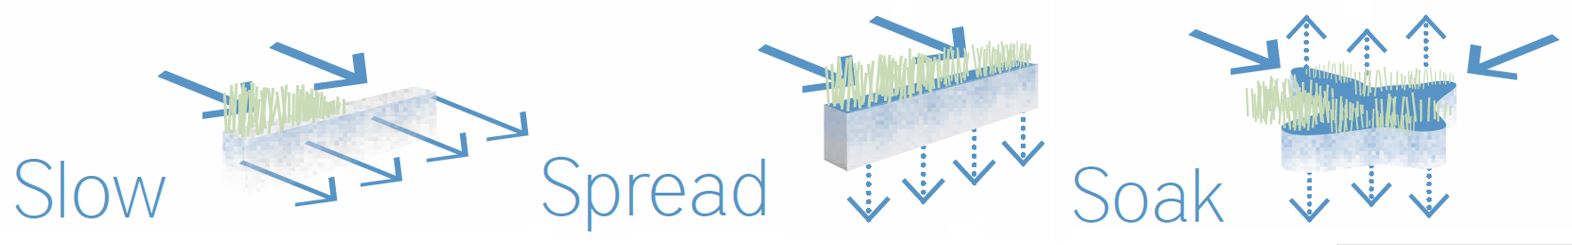
Next steps include developing and prioritizing ways of managing the expected stormwater runoff. With all the pipes present under our roads in the existing stormwater sewer system, uncovering, replacing, and reburying these pipes would require more time, more money, and more traffic displacement than is reasonable...
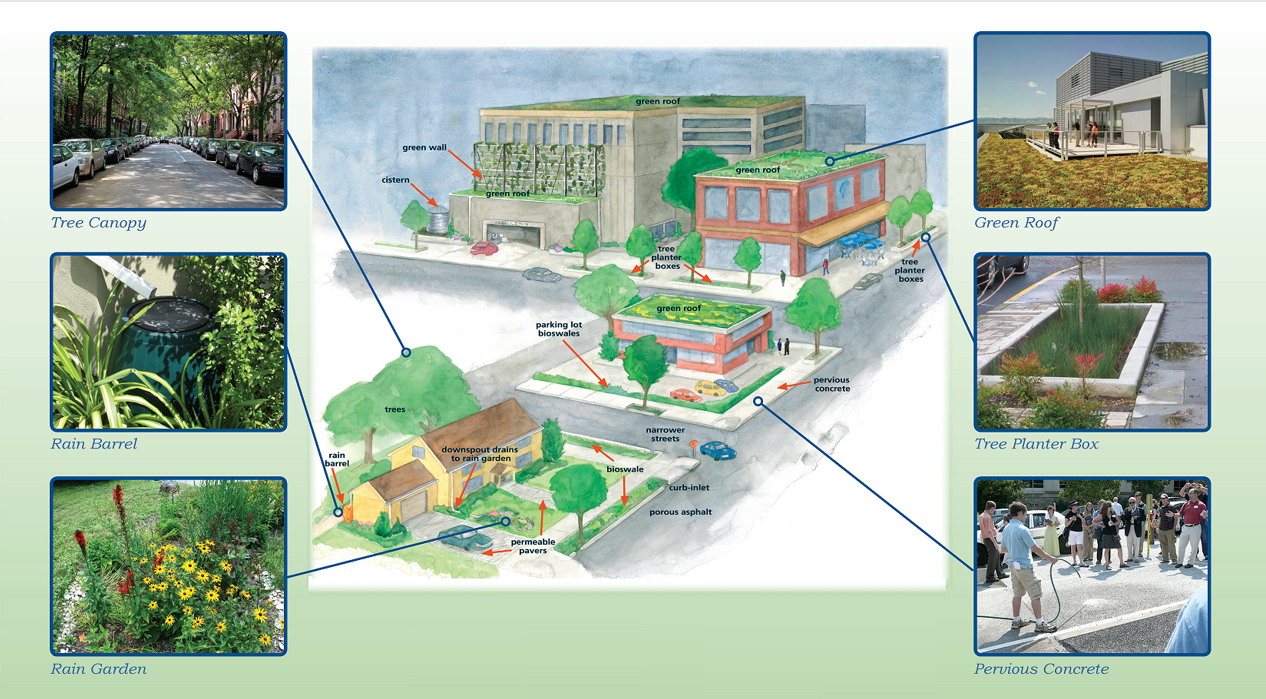
Considering projects that will SLOW, SPREAD, and SOAK runoff into the landscape, while also using the storm sewer system to keep water moving downstream, would add to our storm sewer infrastructure by controlling the flow of stormwater runoff, treat runoff pollution in place, and improve the aesthetics of our neighborhoods.